ROFlow - Optical Flow Results
The ROFlow-Sensor produces an optical flow field of 128 × 128
vectors. Data are given as two streams of 8-bit values. One stream
corresponds to the x-component of the vector field, the other to the
y-component.
Three different methods are offered to visualize the optical flow data:
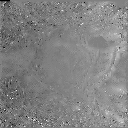
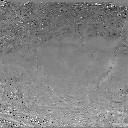
- The two data streams visualized as two separate images.
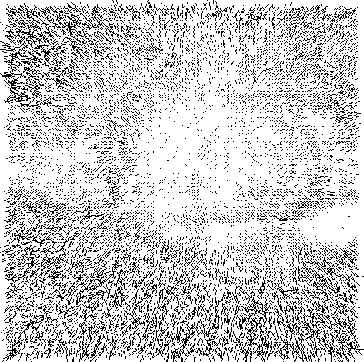
- The data visualized as vector field. Because of the high number
of vectors and the limited resolution of images on HTML pages this
method is only of limited use.
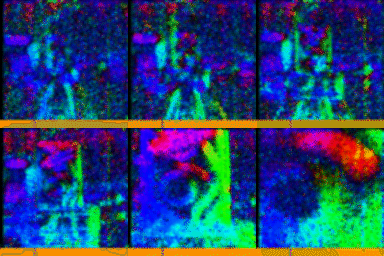
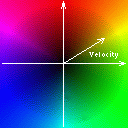
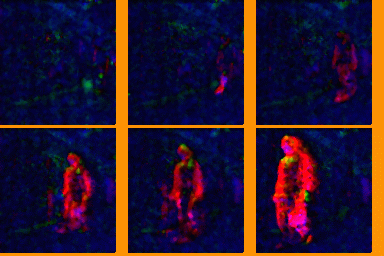
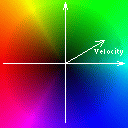
- Visualization through colours. Suppose, we are in HSI colour
system. Then the hue codes the direction and the
intensity the length of the motion vector. A sequence of
measurements demonstrates the motion. This kind of visualization is particular usefull for real data.
Corresponding to the input data, two kind of results are given:
- results from hardware simulations
- experimental results
Simulation
as separate images:
| 
|
| x-component
| y-component
|
as vector field:
Experiment
| 
| 
|
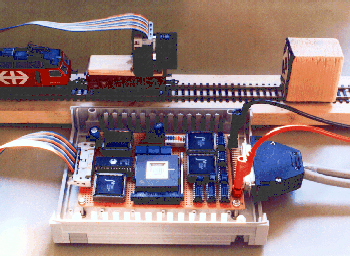
scene:
train approaching to an obstacle
| optical flow
| colour reference map
|
Office Scene
as colour image sequences:
| 
| 
|
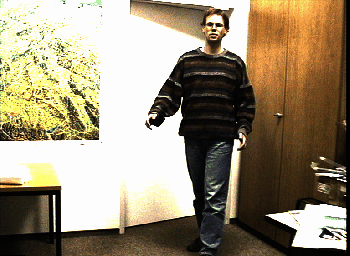
scene:
somebody walking from the left to the right
| optical flow
| colour reference map
|
<- The ROFlow-Sensor (TOP)
<- The Processing Unit
<- The Data Path
Thomas Röwekamp,
GMD-
SET, February 1998


