
We analyzed the following scalars and their phase features:
Analysis of variance, including post hoc testing, indicated the following:
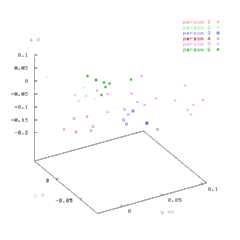
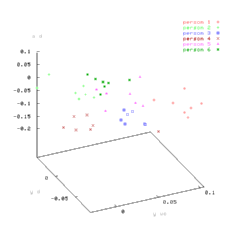
The following scatter plots show the features with the greatest variation, centx, wcentx, and aspct:


We tested recognition using a variety of algorithms. The best results were obtained by finding the nearest neighbor from a set of exemplars, vectors of mean feature values for each subject. To get an unbiased estimate of the recognition rate we used a leave-one-out procedure. Using the full feature vector gives a recognition rate of about 90%. If we use only the four best features, daspct, dcenty, vwcenty, and waspct, then the recognition rate went as high as 95%. In comparison, recognition by chance would yield a rate of about 17%.
Recognition was possible for a variety of flow sources varying in spatial resolution. We observed that while the exemplars changed and the features with the greatest variation changed, as long as the parameters for flow computation were kept constant, recognition is successful.
Analysis of variance and our recognition test show that the features have the following approximate significance for recognition: